This article is intended solely for trading-strategy research and market-structure analysis. It does not constitute investment advice and does not guarantee future returns.
Why Do So Many Traders Buy at the Top and Sell at the Bottom?
Many traders rely on technical indicators such as moving averages, MACD, and RSI to find entry opportunities.
These indicators can certainly help us understand the market, but they all share one characteristic:
They are calculations derived from price, not price itself.
By the time a moving-average golden cross appears, price may already have risen significantly. When a death cross forms, the market may already have fallen considerably.
For this reason, more and more professional traders are focusing on another form of analysis: Market Structure.
Instead of relying on complex mathematical calculations, Market Structure directly examines how price moves and uses the market itself to identify trends, pullbacks, and structural changes.
What Is Market Structure?
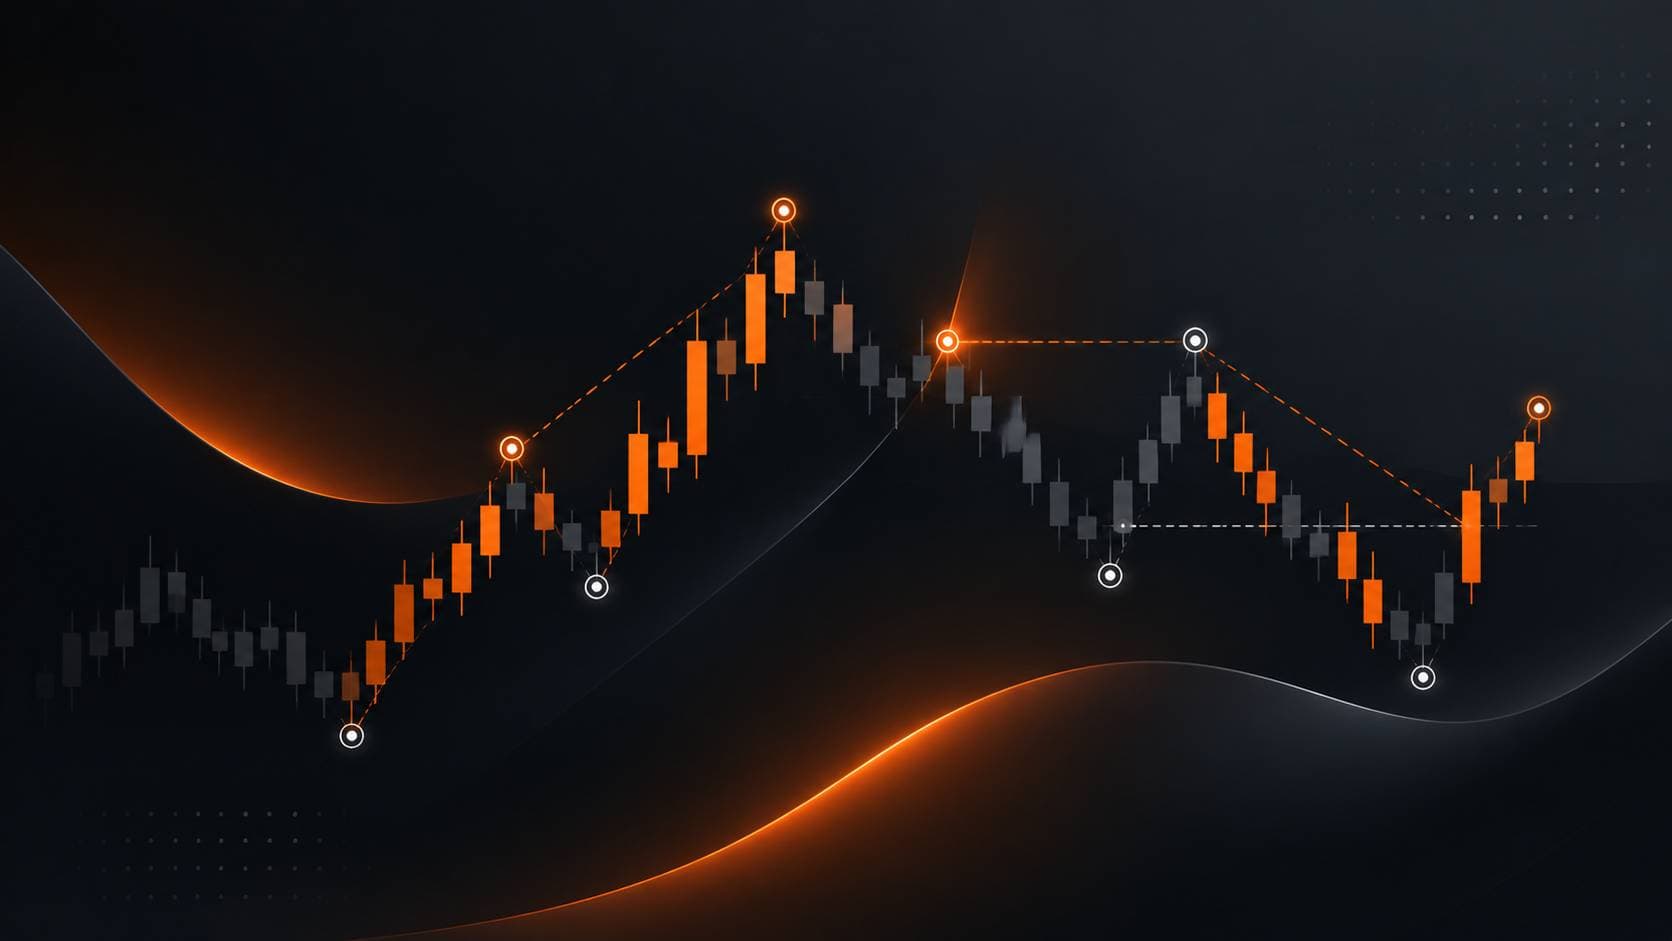
Market Structure is a method for determining market trends by observing changes in price highs and lows.
In an uptrend, the market usually continues to form:
- Higher High (HH)
- Higher Low (HL)
HH
    ↑
   / \
  /   \
HL     HH
  \   /
   \ /
    HL
In a downtrend, the market usually forms:
- Lower High (LH)
- Lower Low (LL)
LH
 \
  \
   LL
    \
     \
      LH
        \
         LL
Compared with traditional indicators, Market Structure focuses more on:
What state is price actually in right now?
Why Pay Attention to Market Structure?
Markets do not rise forever, and they do not fall forever.
What matters is not predicting price, but recognizing:
- Is the market still in an uptrend?
- Has the trend started to weaken?
- Is the market beginning to reverse?
- Is it appropriate to follow the trend now, or should we wait?
These questions are often difficult to answer with moving averages alone.
Market Structure is designed to address them.
NavaX Adds the Market Structure Chart Indicator
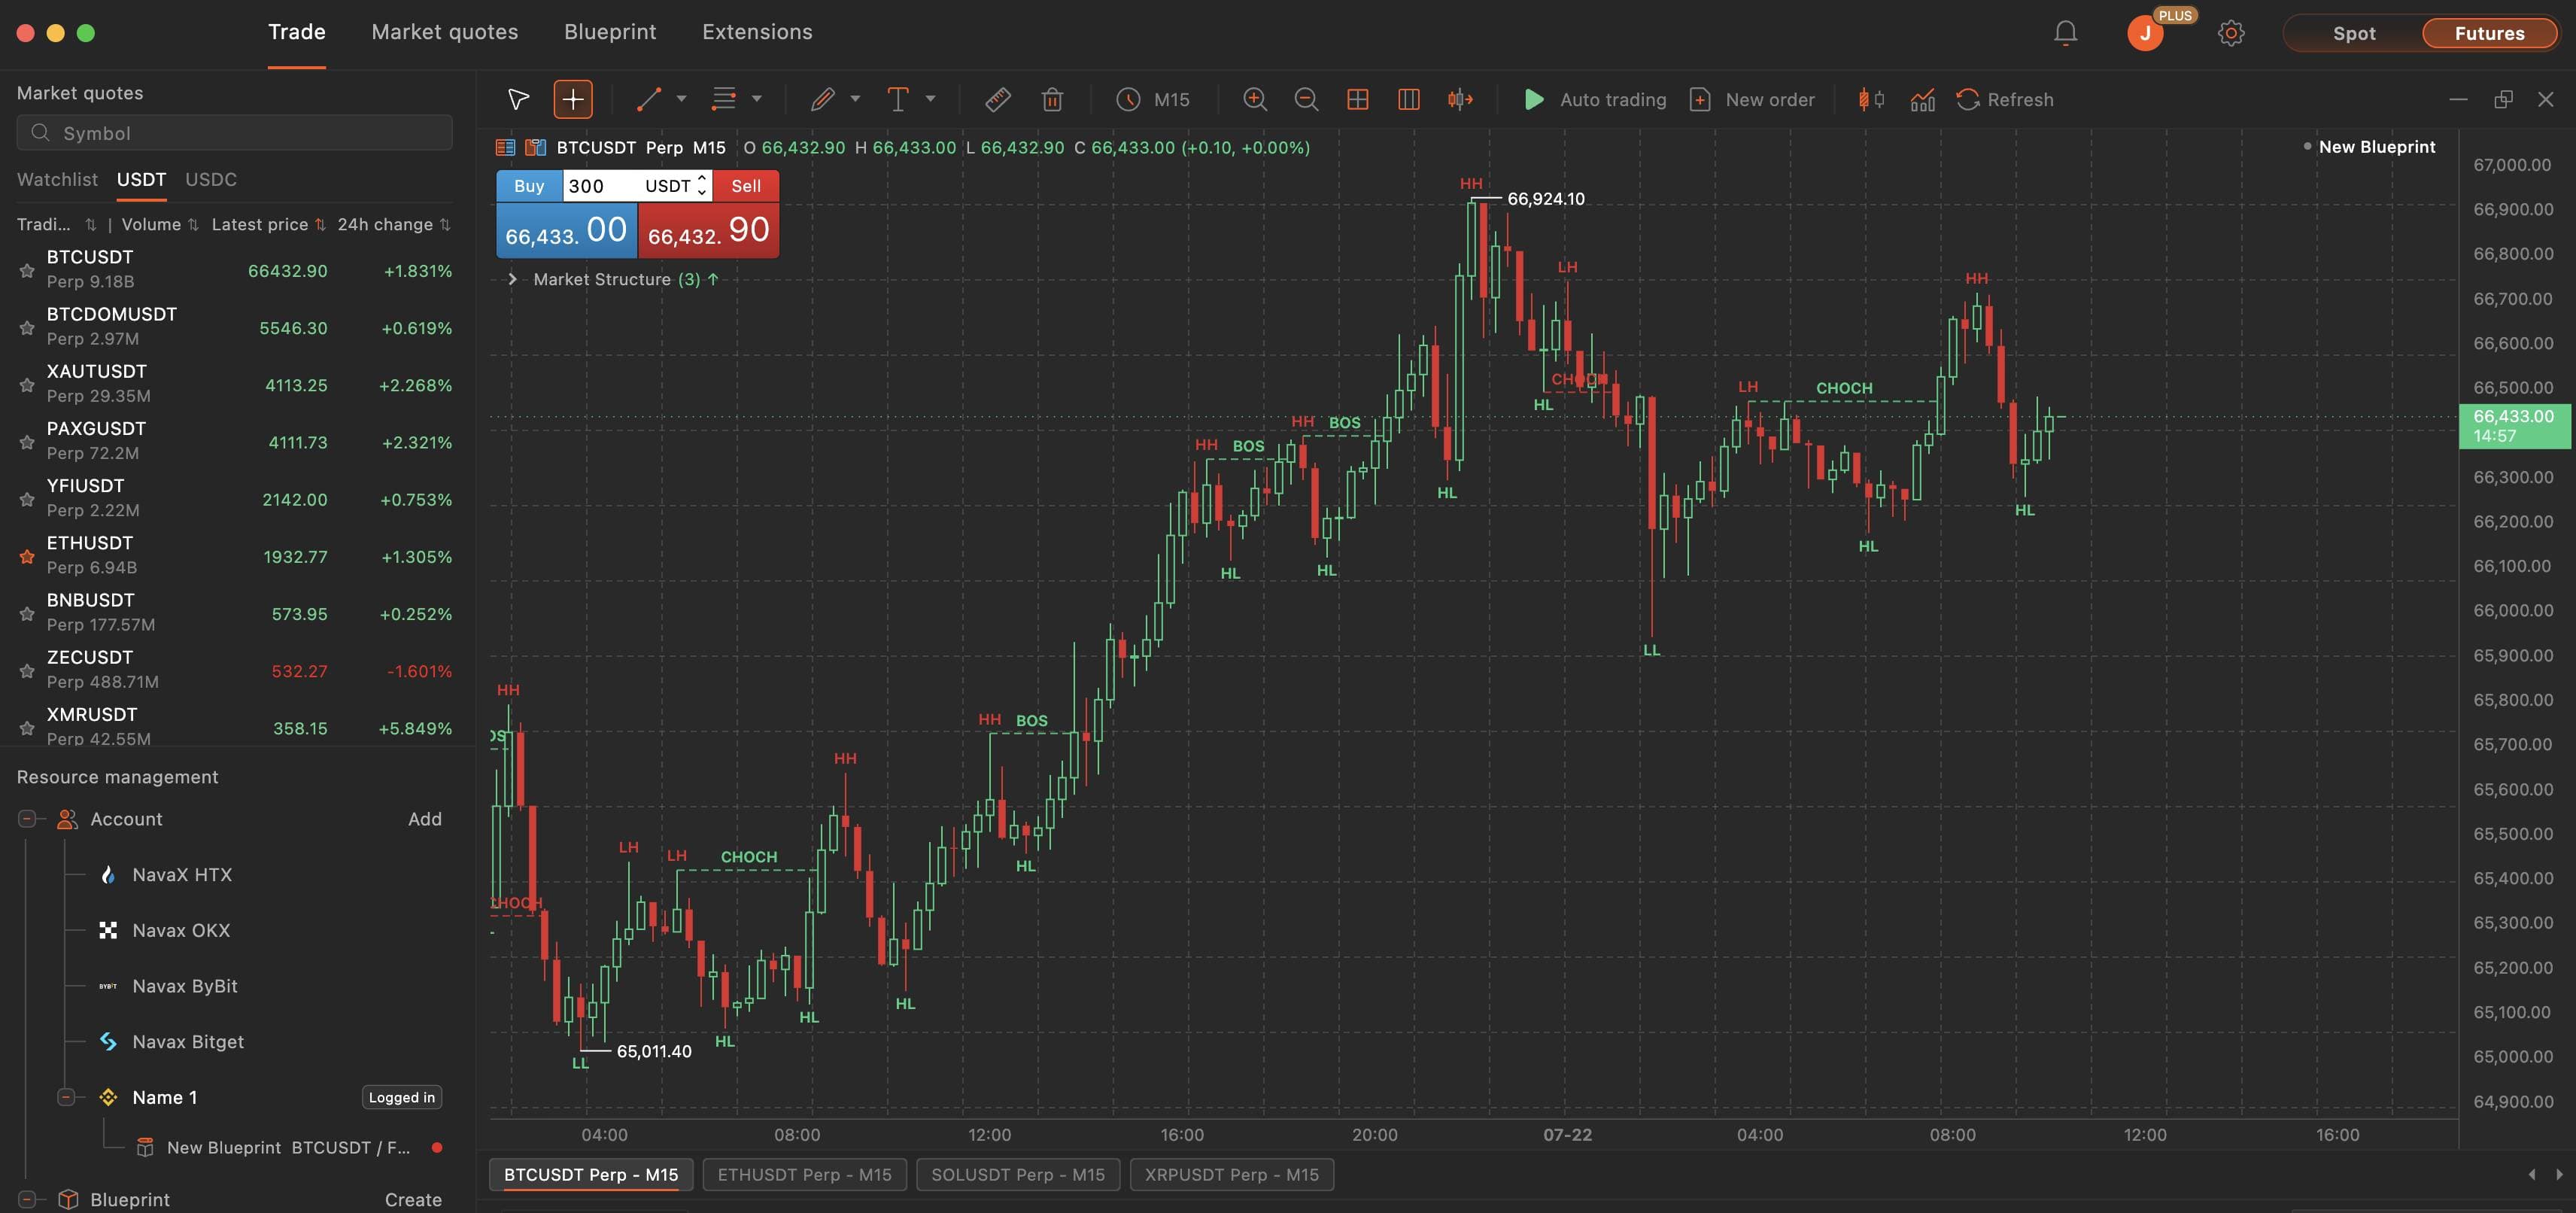
To help traders understand market structure more intuitively, NavaX now includes a Market Structure chart indicator.
Once enabled, the chart automatically identifies and marks important market-structure information, including:
- Swing High
- Swing Low
- Higher High (HH)
- Higher Low (HL)
- Lower High (LH)
- Lower Low (LL)
- Break of Structure (BOS)
- Change of Character (CHoCH)
There is no need to draw structure lines manually. The chart automatically identifies and updates the market structure in real time.
This helps traders understand current conditions more quickly and review historical trend changes more easily.
Break of Structure (BOS)
BOS, or Break of Structure, means:
The market has broken through its existing trend structure.
For example, an uptrend may continue to form HHs and HLs.
When price breaks above the previous Higher High, the uptrend receives further confirmation.
Conversely, when price falls below a key Higher Low, the bullish structure may have been damaged.
BOS is commonly used for:
- Trend confirmation
- Trend continuation
- Researching re-entry after a pullback
Change of Character (CHoCH)
CHoCH, or Change of Character, means:
Market behavior has changed.
For example, the market may have been consistently forming Lower Highs and Lower Lows.
When price breaks above the most recent significant Lower High for the first time, it indicates that market behavior is beginning to change.
This does not necessarily mean the trend has already reversed.
However, it often means:
The market has entered a new phase that deserves closer observation.
CHoCH is commonly used for:
- Studying trend transitions
- Detecting structural changes early
- Identifying potential reversal areas
New Market Structure Blueprint Node
In addition to the chart indicator, this update introduces a Market Structure blueprint node.
Developers can use market structure directly as a trading condition in blueprints without implementing complex logic themselves.
For example:
EMA200 is rising

AND

A Higher Low has formed

AND

Bullish Break of Structure

AND

Volume is increasing

↓

Open Long
Or:
CHoCH appears

AND

A Lower High has formed

↓

Wait for a new short opportunity
Compared with relying only on EMA crossovers or RSI overbought and oversold signals, Market Structure helps a strategy focus more on:
What has actually changed in price behavior.
Market Structure and Traditional Indicators Are Not Competitors
Some traders believe that using Market Structure means they no longer need EMA.
In reality, these tools answer different questions.
For example, EMA can help determine:
Is the current market more suitable for looking for long or short opportunities?
Market Structure can help answer:
When is a more reasonable entry location?
Combining the two is therefore often more stable than using either one alone.
For example:
- EMA determines trend direction
- ADX measures trend strength
- Market Structure checks whether the structure remains intact
- Volume confirms breakout quality
- ATR manages risk
Each tool performs a different task rather than replacing the others.
Focus More on Location Than on Signals
Strong trading strategies are not built by constantly searching for more signals.
They are built by looking for:
Locations with a better statistical advantage.
Market Structure does not tell you that price will definitely rise or fall in the future.
Instead, it helps you assess:
- Whether the current trend remains healthy
- Whether price is maintaining its structure
- Whether market behavior has changed
- Whether the current situation is worth waiting for
Build trading decisions on market structure rather than speculation.
Summary
This NavaX update introduces:
- Market Structure chart indicator
- Market Structure blueprint node
- Automatic HH / HL / LH / LL identification
- Automatic Swing High / Swing Low identification
- BOS (Break of Structure)
- CHoCH (Change of Character)
Whether you trade manually or develop automated blueprints, Market Structure can help you understand trends and identify important locations more intuitively. You can combine it with moving averages, volume, ATR, and other tools to build a clearer and more robust trading-research workflow.